
SHUHUA (JESSICA) YIN
Graduate student of Data Science and Business Analytics at University of North Carolina - Charotte
For more projects I am working on and have done:
*Any use of my work needs my permission please contact me before doing so*
*The below samples are from the projects I have done for two of my courses: Visual Analytics, Big Data Analytics for Comparative Advantage*
Visual Analytics:
IMDB Movie Data Visual Explorations
Our team performed wrangling and feature processing on IMDB movie data of 1916 to 2016 using R and Tableau. We designed visuals showing relationship between movie 'budget' and 'gross' in terms of 'content rating'. Below images show a simple Shiny app using R made by myself, presenting how movie Gross changes throughout 1916 to 2016 filtered by Content Rating (only took screenshots of the interactive visuals and code since the app itself cannot be uploaded onto the page). We also created word cloud showing words to indicate key predictors for movie revenue outcomes in R (ggplot).
 |  |
|---|---|
 |  |
 |  |
*all names of the group members are listed in the linked PDF report and PowerPoint presentation for credits
Big Data Analytics for Comparative Advantage:
Analytics Modeling on Claim Dataset (Phase 1)
-
Summarizing the key challenges faced by workers' compensation claims management on work injuries
-
Adding additional variables/external data to the given data
-
Finding the factors affecting claims cost and processing time
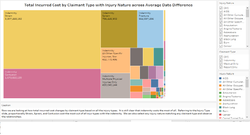
Sample of the Tableau part of the project (made by myself) - Email me for the complete version of Tableau Workbook
 |  |  |
|---|---|---|
 |  |  |
Analytics Modeling on Claim Dataset (Phase 2)
-
Using prediction model to examine hypotheses derived from Phase 1
-
Examining and comparing how each of the models (regression, logistic, decision tree) can be used
-
Implementing logistic regression model to present the results and insights
-
Finding recommendations to improve productivity
Link to full report and PowerPoint presentation